Create histograms for all numeric variables in a dataset. Non-numeric variables will be dropped.
Arguments
- d
<dfr>A data frame.- cols
<var>Optional. Columns to plot as a vector of unquoted names.- bins
<int>Number of bins.- nsub
<lgl>Show number of observations.- ...
Additional arguments for ggplot2::geom_histogram.
Examples
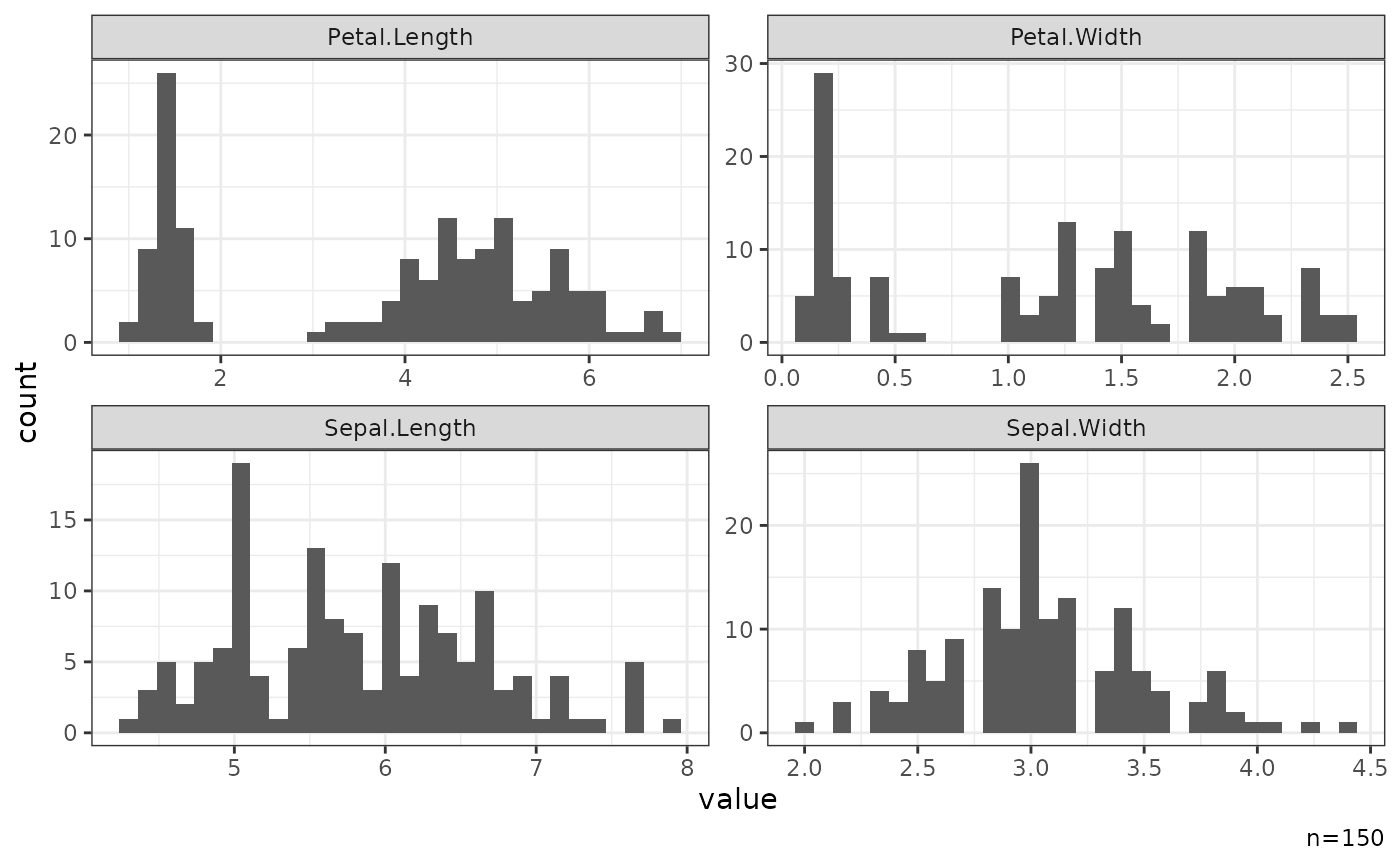
iris |> gghist()
#> NB: Non-numeric variables are dropped.
#> Dropped: Species
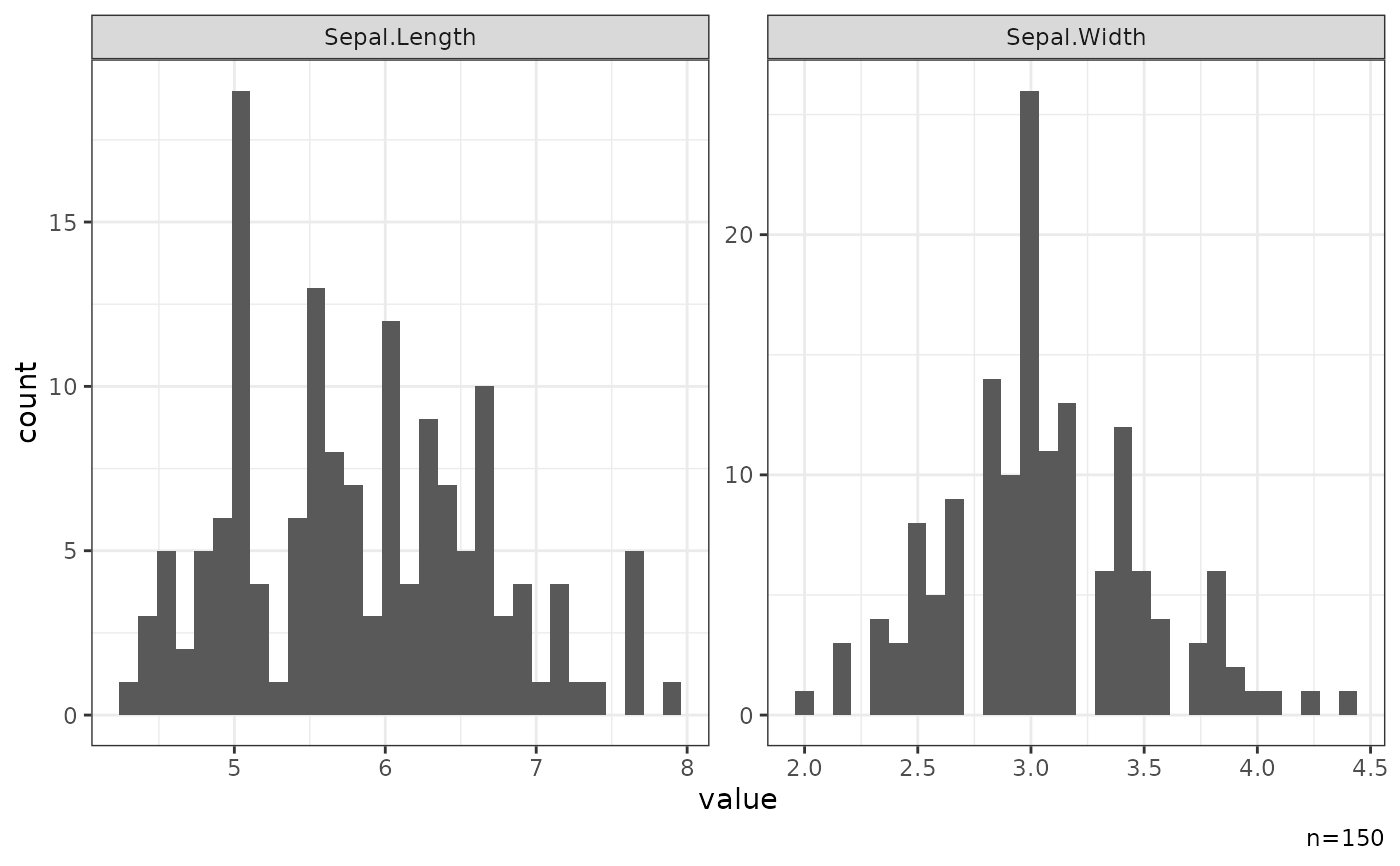
 iris |> gghist(c(Sepal.Width,Sepal.Length))
#> NB: Non-numeric variables are dropped.
#> Dropped:
iris |> gghist(c(Sepal.Width,Sepal.Length))
#> NB: Non-numeric variables are dropped.
#> Dropped: